Analysis of AirBnb listings in Portland, Seattle, and Vancouver.
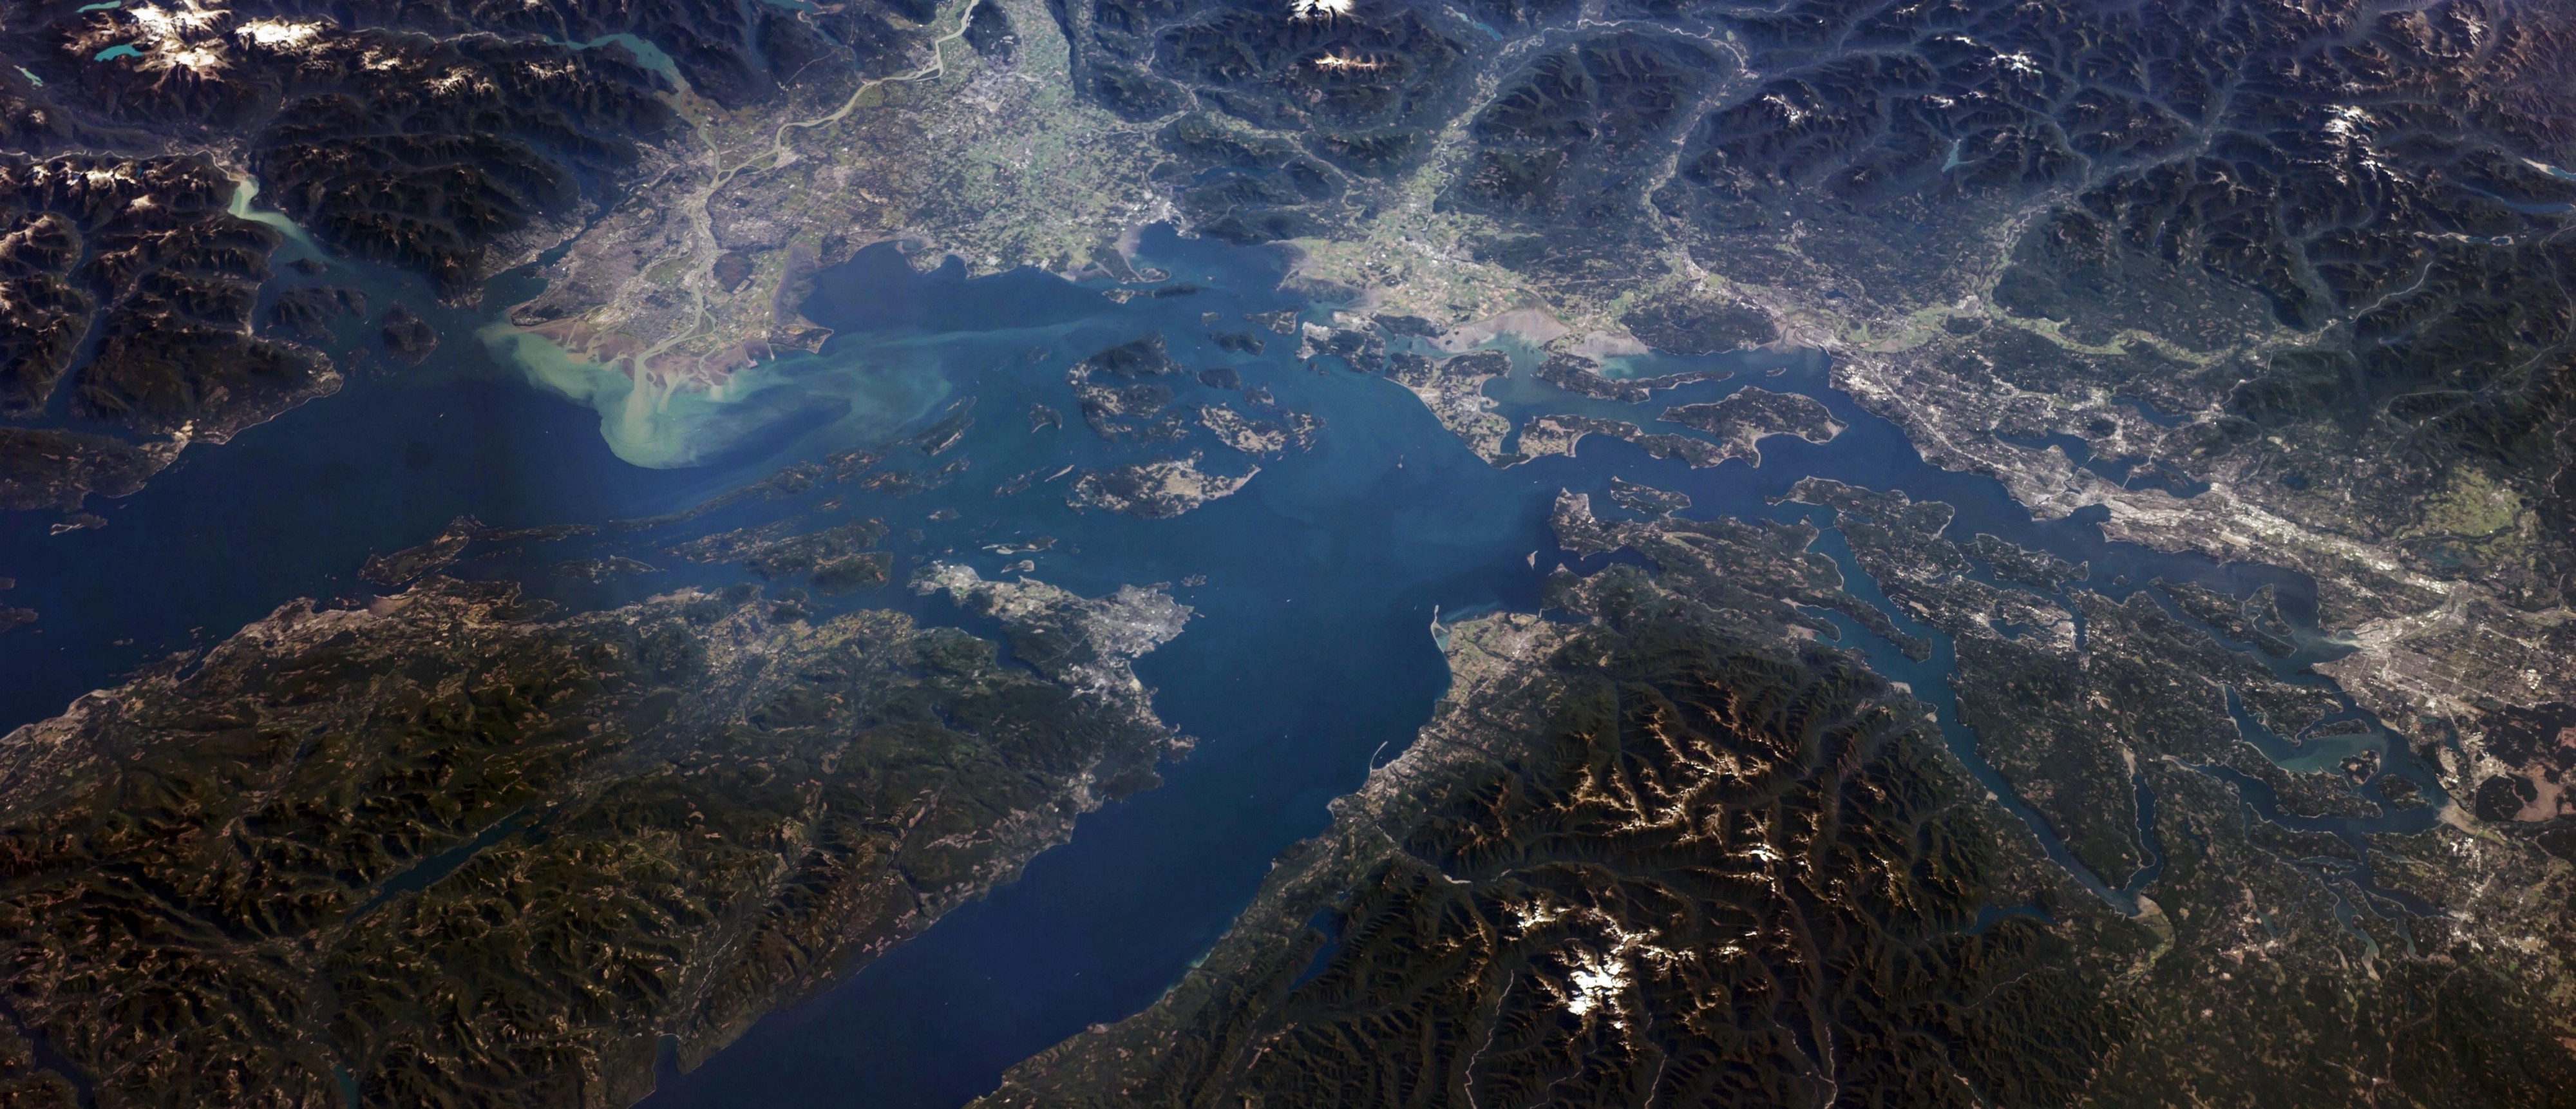 The Salish Sea.
The Pacific Northwest is well-known for its rich natural beauty. But while many people may come to see the Douglas firs or the Cascade mountains, the major cities of the region are destinations themselves.
In recent years, AirBnb listings have proliferated in Portland, Seattle, and Vancouver, to the extent that all three cities have recently passed short-term rental ordinances in response (Vancouver was the first in North America and Portland and Seattle soon followed suit)
Being a Seattle resident for many years and a regular AirBnb-er in all three cities, I wanted to learn more about listings there, so decided to go get some data and analyze it! More specifically, I wanted to learn more about the price of listings and better understand guest satisfaction with them. What makes for a highly rated listing? Does price make a difference?
AirBnb is pretty cool about making their data publicly available, but InsideAirBnb has done a lot of work collecting and organizing it and making it accessible in one place (thank you, Inside AirBnb 🙏). I grabbed the most current data available (from February 2020) and explored it with the Python data stack.
Code and notebooks are in a GitHub repo
Here’s the questions I asked and the answers I found.
How do listing prices relate to location?
All prices were converted to USD to make comparison meaningful. There was a huge spread in prices, from the low double-digits to the thousands, but the spread was similar across all three cities. Portland had the lowest listing price while Seattle had the highest. As of November 2019, the median prices of listings (in USD) were Portland $90, Vancouver $95, Seattle $115.
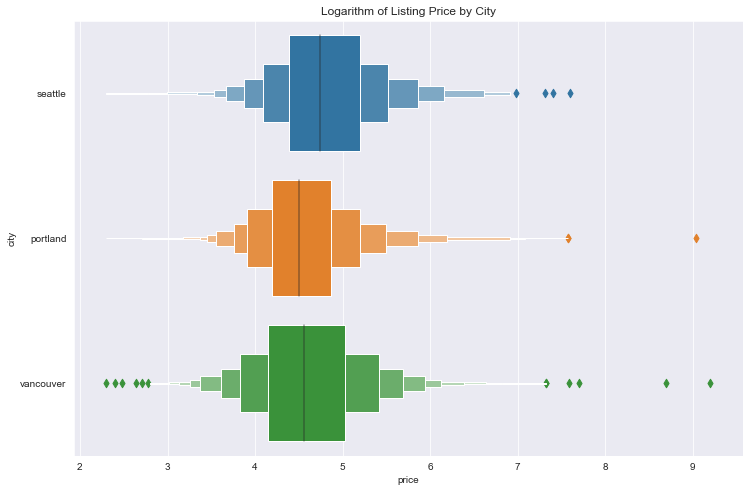 Using logarithm of price for easier visualization
I also found some suggestive visual evidence that neighbourhoods closer to downtown were more expensive in all three cities.
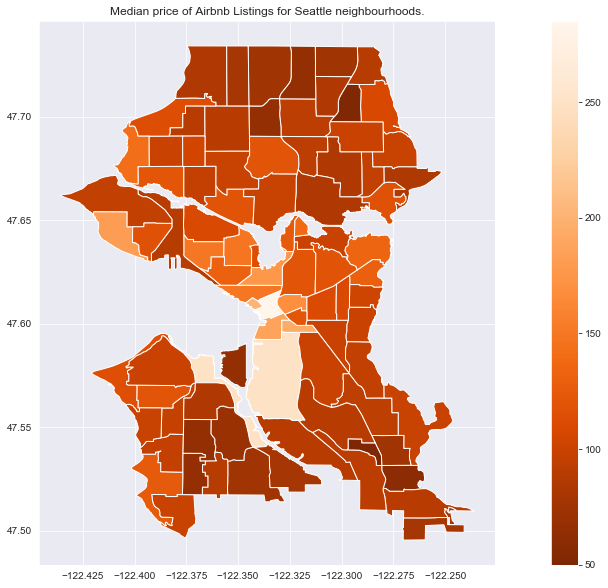 Neighbourhoods closer to downtown seem to have higher prices.
Neighbourhoods closest to downtown are also among the priciest. Among neighbourhoods with at least 10 listings, the 5 most expensive neighbourhoods (by median price) in each city were
| Portland | Seattle | Vancouver |
|---|---|---|
| Pearl $180 | Central Business District $285.5 | Downtown $120.5 |
| Downtown $169 | Pike-Market $201 | Downtown-Eastside $113 |
| Northwest District $120 | International District $195 | Kitsilano $112 |
| Goose Hollow $119.5 | Pioneer Square $187.5 | Mount Pleasant $103.5 |
| Bridgeton $120 | Briarcliff $182 | West End $100 |
while the 5 least expensive were
| Portland | Seattle | Vancouver |
|---|---|---|
| Mill Park $44 | Meadowbrook $51 | Renfrew-Collingwood $57 |
| Centennial $45 | Dunlap $60 | Oakridge $60 |
| Lents $50 | High Point $65 | Victoria-Fraserview $68 |
| Madison South $50 | North College Park $65 | Killarney $68 |
| Parkrose $55 | Pinehurst $65 | Marpole $72 |
If you’re traveling on a budget, you might want to steer clear of neighborhoods near downtown (especially in Seattle!).
How do listing prices change over time?
Since historical booking data was unavailable, to look at price trends I analyzed the booking calendar, that is the price to book each listing for each day for the next 12 months.
Results here were not too suprising. I found an expected weekly trend in overall price, as well as a seasonal trend, with a steady increase in price from early spring to summer. Price declined again reaching a low around the 2021 winter holidays but then strangely rising again in January-February 2021.
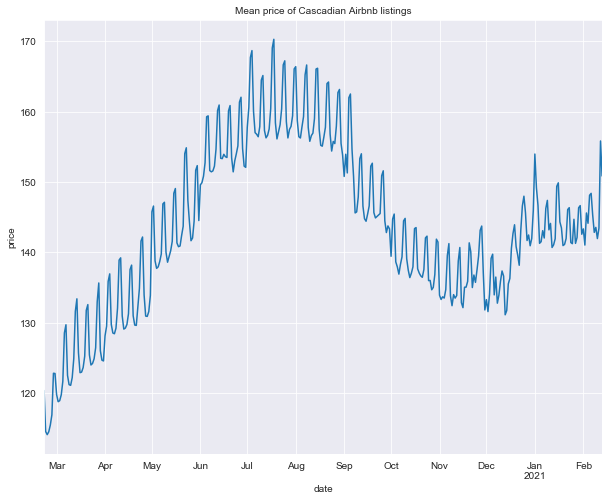 Prices overall go up and down every week and peak in late summer.
Plots of price by city showed similar patterns – weekly price fluctuations and a steady increase reaching a maximum in late summer but there were some clear differences. The weekly price trend is much less pronounced in Vancouver than Seattle and Portland, while the summer price trend is much more pronounced in Seattle than Vancouver or Portland. Seattle and Portland prices both show the January-February 2021 increase we saw overall but Vancouver price does not.
The January-February 2021 price increase is most pronounced in Portland in fact at its peak it exceeds peak summer price by around $10 (about 8%). During this time, Portland median price exceeds Vancouver’s.
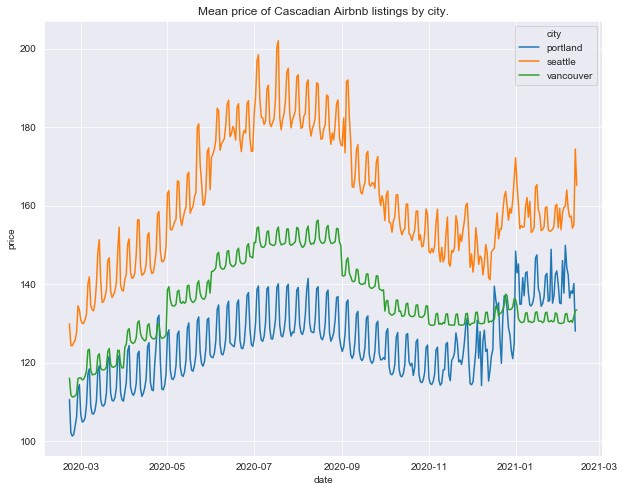 Price trends are similar across cities, but Seattle see the biggest summer peak.
Late summer is the most expensive time of year to visit all three cities (not suprising since it’s usual the longest stretch of warm dry weather in a region known for cold and wet), but since this seasonal price increase is much more pronounced for Seattle. If you want to visit the Pacific Northwest during late summer Vancouver and Portland look like more affordable options.
How does overall guest satisfaction relate to location?
I used the listing overall average rating as a measure of guest satisfaction. Ratings overall were skewed high, with 50% of listings receiving an average rating of 97 or above.
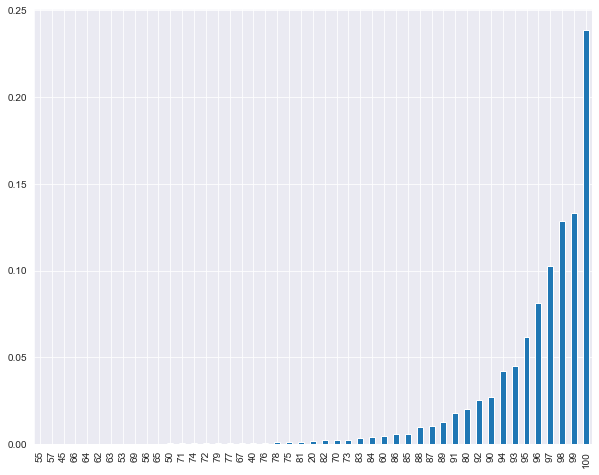 Most listings have really high ratings.
I found that Portland had higher listing ratings than Seattle or Vancouver - the median ratings were Portland 98, Seattle 97, and Vancouver 97.
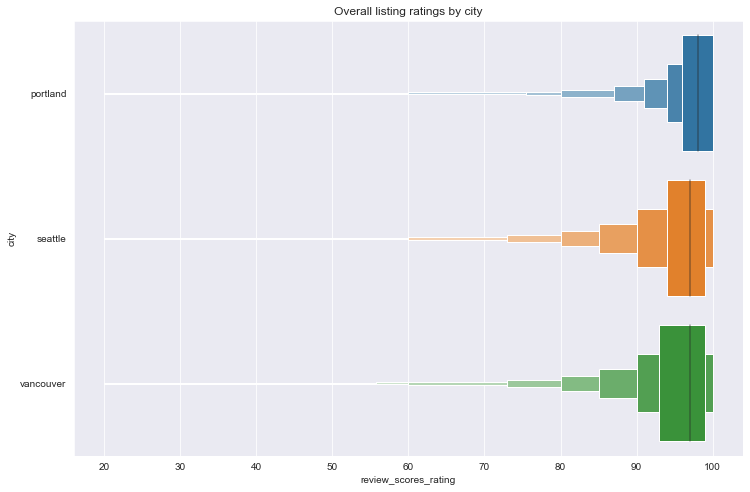 Ratings are distributed similarly for all three cities.
Among neighbourhoods with at least 10 listings, the 5 neighbourhoods with highest median ratings were
| Portland | Seattle | Vancouver |
|---|---|---|
| West Portland Park 100 | Interbay 100 | Mount Pleasant 98 |
| Alameda 99 | Laurelhurst 99.5 | Riley Park 98 |
| Centennial 99 | Crown Hill 99 | Arbutus Ridge 97 |
| Concordia 99 | East Queen Anne 99 | Downtown Eastside 97 |
| Eastmoreland 99 | Fairmount Park 99 | Dunbar Southlands 97 |
and the 5 neighbourhoods with lowest ratings were
| Portland | Seattle | Vancouver |
|---|---|---|
| Hayhurst 95 | International District 91.5 | Killarney 94.5 |
| Bridgeton 96 | Pioneer Square 92 | Marpole 95 |
| Mill Park 96 | South Beacon Hill 93.5 | Shaugnessy 95 |
| Old Town/Chinatown 96 | Central Business District 95 | Victoria-Fraserview 95 |
| Powellhurst-Gilbert 96 | Pinehurst 95 | Arbutus Ridge 96 |
Seattle stands out as having the lowest rated neighorhoods.
How do listing prices in neighbourhoods relate to guest satisfaction?
I found weak evidence of a negative relationship between price and rating overall, and in Portland and Seattle, with Seattle showing the stronger relationship. I found strong evidence of a positive relationship between price and rating in Vancouver.
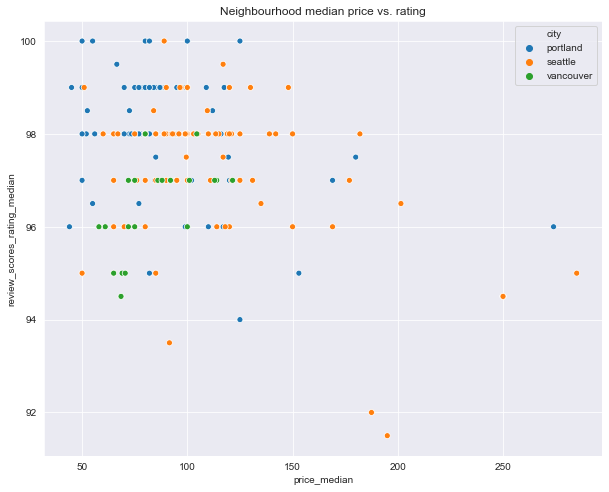
This has potentially positive implications for the budget traveler headed for Portland or Seattle!
Which listing features are most closely related to guest satisfaction?
Among the most important features related to overall rating were
- The number of reviews a listing has, as well as the the number of reviews per month.
- Price, cleaning fee and security deposit.
- How long the host has been hosting and their response and acceptance rate.
- The number of amenities the listing has.
- Whether the listing has a coffee maker!
None of these features are perhaps too surprising – except the presence of a coffee maker!
We can speculate about why these features are ranked highly.
Reviews per month and number of reviews seem reasonable – listings with higher reviews may be more frequently booked and hence more frequently reviewed. Price, cleaning fee and security deposit may have association to quality factors such as value of property (as well as to each other). Days hosting or number of amenities might be associated to positive guest experience.
Further investigation of these associations can help shed light on these speculations but that’s a topic for another project.
Thanks for reading, and I hope you found something interesting or useful.