islr notes and exercises from An Introduction to Statistical Learning
9. Support Vector Machines
Exercise 6: SVCs for barely linearly separable data
%matplotlib inline
import matplotlib.pyplot as plt
import matplotlib.pyplot as plt
import numpy as np
import pandas as pd
import seaborn as sns; sns.set_style('whitegrid')
import warnings
warnings.simplefilter(action='ignore', category=FutureWarning)
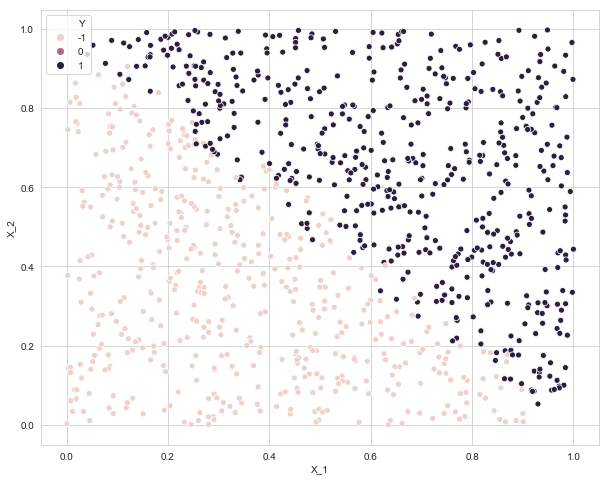
a. Generate data and scatterplot
data = pd.DataFrame({'X_1': np.random.uniform(size=1000), 'X_2': np.random.uniform(size=1000),
                     'Y': np.zeros(1000)})

np.random.seed(27)

for i in data.index:
    X_1, X_2 = data.loc[i, 'X_1'], data.loc[i, 'X_2']
    if X_1 + X_2 > 1.05:
        data.loc[i, 'Y'] = 1
    elif X_1 + X_2 < 0.95:
        data.loc[i, 'Y'] = -1
    else:
        data.loc[i, 'Y'] = np.random.choice([-1, 1])

data.loc[:, 'Y'] = pd.to_numeric(data['Y'], downcast='integer')
data.head()
| X_1 | X_2 | Y | |
|---|---|---|---|
| 0 | 0.349514 | 0.564869 | -1 |
| 1 | 0.336660 | 0.669171 | 1 |
| 2 | 0.452217 | 0.179149 | -1 |
| 3 | 0.724898 | 0.141218 | -1 |
| 4 | 0.509156 | 0.747757 | 1 |
plt.figure(figsize=(10, 8))
sns.scatterplot(x=data['X_1'], y=data['X_2'], data=data, hue='Y')
<matplotlib.axes._subplots.AxesSubplot at 0x105e2d208>
b. Cross-validation error for SVC as a function of cost parameter
from sklearn.svm import SVC
from sklearn.model_selection import GridSearchCV

# cost parameter
params = {'C': np.linspace(1, 50, 1000)}

# fit model
svc = SVC(kernel='linear')
svc_search = GridSearchCV(svc,
                          param_grid=params,
                          cv=10,
                          scoring='accuracy')
svc_search.fit(data[['X_1', 'X_2']], data['Y'])
GridSearchCV(cv=10, error_score='raise-deprecating',
       estimator=SVC(C=1.0, cache_size=200, class_weight=None, coef0=0.0,
  decision_function_shape='ovr', degree=3, gamma='auto_deprecated',
  kernel='linear', max_iter=-1, probability=False, random_state=None,
  shrinking=True, tol=0.001, verbose=False),
       fit_params=None, iid='warn', n_jobs=None,
       param_grid={'C': array([ 1.     ,  1.04905, ..., 49.95095, 50.     ])},
       pre_dispatch='2*n_jobs', refit=True, return_train_score='warn',
       scoring='accuracy', verbose=0)
svc_search_df = pd.DataFrame(svc_search.cv_results_)
svc_search_df.head()
| mean_fit_time | std_fit_time | mean_score_time | std_score_time | param_C | params | split0_test_score | split1_test_score | split2_test_score | split3_test_score | ... | split2_train_score | split3_train_score | split4_train_score | split5_train_score | split6_train_score | split7_train_score | split8_train_score | split9_train_score | mean_train_score | std_train_score | |
|---|---|---|---|---|---|---|---|---|---|---|---|---|---|---|---|---|---|---|---|---|---|
| 0 | 0.005417 | 0.001175 | 0.001424 | 0.000477 | 1 | {'C': 1.0} | 0.950495 | 0.950495 | 0.940594 | 0.93 | ... | 0.952169 | 0.956667 | 0.951111 | 0.952222 | 0.953333 | 0.957825 | 0.952275 | 0.948946 | 0.953334 | 0.002893 |
| 1 | 0.004414 | 0.000236 | 0.001259 | 0.000308 | 1.04905 | {'C': 1.049049049049049} | 0.950495 | 0.950495 | 0.950495 | 0.93 | ... | 0.952169 | 0.957778 | 0.951111 | 0.953333 | 0.953333 | 0.957825 | 0.952275 | 0.950055 | 0.953667 | 0.002855 |
| 2 | 0.004460 | 0.000329 | 0.001215 | 0.000190 | 1.0981 | {'C': 1.098098098098098} | 0.950495 | 0.950495 | 0.950495 | 0.93 | ... | 0.951057 | 0.957778 | 0.951111 | 0.953333 | 0.953333 | 0.956715 | 0.953385 | 0.952275 | 0.953555 | 0.002108 |
| 3 | 0.004940 | 0.000989 | 0.001507 | 0.000670 | 1.14715 | {'C': 1.147147147147147} | 0.950495 | 0.950495 | 0.950495 | 0.93 | ... | 0.952169 | 0.957778 | 0.951111 | 0.954444 | 0.953333 | 0.956715 | 0.952275 | 0.951165 | 0.954000 | 0.002438 |
| 4 | 0.005254 | 0.000438 | 0.001622 | 0.000398 | 1.1962 | {'C': 1.1961961961961962} | 0.950495 | 0.950495 | 0.960396 | 0.93 | ... | 0.953281 | 0.957778 | 0.951111 | 0.954444 | 0.952222 | 0.956715 | 0.952275 | 0.952275 | 0.954111 | 0.002326 |
5 rows × 31 columns
sns.lineplot(x=np.linspace(1, 50, 1000), y=svc_search_df['mean_test_score'])
plt.xlabel('logc.')
Text(0.5, 0, 'logc.')
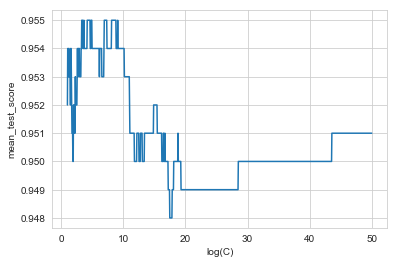
svc_search.best_params_
{'C': 3.305305305305305}
svc_search.best_score_
0.955
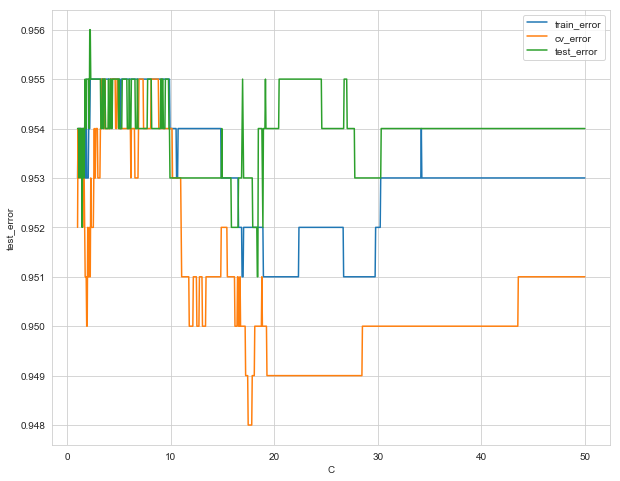
c. Test error for SVC as a function of cost parameter
# generate test data
np.random.seed(27)
test_data = pd.DataFrame({'X_1': np.random.uniform(size=1000), 'X_2': np.random.uniform(size=1000),
                     'Y': np.zeros(1000)})

for i in test_data.index:
    X_1, X_2 = test_data.loc[i, 'X_1'], test_data.loc[i, 'X_2']
    if X_1 + X_2 > 1.05:
        test_data.loc[i, 'Y'] = 1
    elif X_1 + X_2 < 0.95:
        test_data.loc[i, 'Y'] = -1
    else:
        test_data.loc[i, 'Y'] = np.random.choice([-1, 1])

test_data.loc[:, 'Y'] = pd.to_numeric(test_data['Y'], downcast='integer')
from sklearn.metrics import accuracy_score

# train and test data
X_train, Y_train = data[['X_1', 'X_2']], data['Y']
X_test, Y_test = test_data[['X_1', 'X_2']], test_data['Y']

# trained models
svcs = {C: SVC(kernel='linear', C=C).fit(X_train, Y_train) for C in np.linspace(1, 50, 1000)}

# errors df
svcs_train_errors = np.array([accuracy_score(svcs[C].predict(X_train), Y_train) for C in svcs])
svcs_test_errors = np.array([accuracy_score(svcs[C].predict(X_test), Y_test) for C in svcs])
svcs_errors_df = pd.DataFrame({'C': np.linspace(1, 50, 1000),
                               'train_error': svcs_train_errors,
                               'cv_error': svc_search_df['mean_test_score'],
                               'test_error': svcs_test_errors
                                })
svcs_errors_df.head()
| C | train_error | cv_error | test_error | |
|---|---|---|---|---|
| 0 | 1.000000 | 0.953 | 0.952 | 0.954 |
| 1 | 1.049049 | 0.954 | 0.954 | 0.954 |
| 2 | 1.098098 | 0.954 | 0.953 | 0.954 |
| 3 | 1.147147 | 0.954 | 0.953 | 0.953 |
| 4 | 1.196196 | 0.954 | 0.954 | 0.954 |
plt.figure(figsize=(10, 8))
sns.lineplot(x='C', y='train_error', data=svcs_errors_df, label='train_error')
sns.lineplot(x='C', y='cv_error', data=svcs_errors_df, label='cv_error')
sns.lineplot(x='C', y='test_error', data=svcs_errors_df, label='test_error')
plt.legend()
<matplotlib.legend.Legend at 0x1a1a1dc1d0>