islr notes and exercises from An Introduction to Statistical Learning
8. Tree-based Methods
Exercise 10: Boosting to predict Salary in Hitters dataset
- Preparing the data
- a. Remove observations with missing
Salaryand log-transformSalary - b. Train test split
- c. Boosting on training set
- d. Plotting train error, cv test error estimate, and test error
- e. Comparing errors with OLS, Lasso, and Ridge Regression models
- f. Which variables are the most important in the boosted tree model?
- Bagged tree
Preparing the data
%matplotlib notebook
import matplotlib.pyplot as plt
import numpy as np
import pandas as pd
import seaborn as sns; sns.set_style('whitegrid')
import warnings
warnings.simplefilter(action='ignore', category=FutureWarning)
hitters = pd.read_csv('../../datasets/Hitters.csv')
hitters = hitters.rename(columns={'Unnamed: 0': 'Name'})
hitters.head()
| Name | AtBat | Hits | HmRun | Runs | RBI | Walks | Years | CAtBat | CHits | ... | CRuns | CRBI | CWalks | League | Division | PutOuts | Assists | Errors | Salary | NewLeague | |
|---|---|---|---|---|---|---|---|---|---|---|---|---|---|---|---|---|---|---|---|---|---|
| 0 | -Andy Allanson | 293 | 66 | 1 | 30 | 29 | 14 | 1 | 293 | 66 | ... | 30 | 29 | 14 | A | E | 446 | 33 | 20 | NaN | A |
| 1 | -Alan Ashby | 315 | 81 | 7 | 24 | 38 | 39 | 14 | 3449 | 835 | ... | 321 | 414 | 375 | N | W | 632 | 43 | 10 | 475.0 | N |
| 2 | -Alvin Davis | 479 | 130 | 18 | 66 | 72 | 76 | 3 | 1624 | 457 | ... | 224 | 266 | 263 | A | W | 880 | 82 | 14 | 480.0 | A |
| 3 | -Andre Dawson | 496 | 141 | 20 | 65 | 78 | 37 | 11 | 5628 | 1575 | ... | 828 | 838 | 354 | N | E | 200 | 11 | 3 | 500.0 | N |
| 4 | -Andres Galarraga | 321 | 87 | 10 | 39 | 42 | 30 | 2 | 396 | 101 | ... | 48 | 46 | 33 | N | E | 805 | 40 | 4 | 91.5 | N |
5 rows × 21 columns
hitters.info()
<class 'pandas.core.frame.DataFrame'>
RangeIndex: 322 entries, 0 to 321
Data columns (total 21 columns):
Name         322 non-null object
AtBat        322 non-null int64
Hits         322 non-null int64
HmRun        322 non-null int64
Runs         322 non-null int64
RBI          322 non-null int64
Walks        322 non-null int64
Years        322 non-null int64
CAtBat       322 non-null int64
CHits        322 non-null int64
CHmRun       322 non-null int64
CRuns        322 non-null int64
CRBI         322 non-null int64
CWalks       322 non-null int64
League       322 non-null object
Division     322 non-null object
PutOuts      322 non-null int64
Assists      322 non-null int64
Errors       322 non-null int64
Salary       263 non-null float64
NewLeague    322 non-null object
dtypes: float64(1), int64(16), object(4)
memory usage: 52.9+ KB
hitters = pd.concat([hitters['Name'],
                     pd.get_dummies(hitters.drop(columns=['Name']), drop_first=True)], axis=1)
hitters.head()
| Name | AtBat | Hits | HmRun | Runs | RBI | Walks | Years | CAtBat | CHits | ... | CRuns | CRBI | CWalks | PutOuts | Assists | Errors | Salary | League_N | Division_W | NewLeague_N | |
|---|---|---|---|---|---|---|---|---|---|---|---|---|---|---|---|---|---|---|---|---|---|
| 0 | -Andy Allanson | 293 | 66 | 1 | 30 | 29 | 14 | 1 | 293 | 66 | ... | 30 | 29 | 14 | 446 | 33 | 20 | NaN | 0 | 0 | 0 |
| 1 | -Alan Ashby | 315 | 81 | 7 | 24 | 38 | 39 | 14 | 3449 | 835 | ... | 321 | 414 | 375 | 632 | 43 | 10 | 475.0 | 1 | 1 | 1 |
| 2 | -Alvin Davis | 479 | 130 | 18 | 66 | 72 | 76 | 3 | 1624 | 457 | ... | 224 | 266 | 263 | 880 | 82 | 14 | 480.0 | 0 | 1 | 0 |
| 3 | -Andre Dawson | 496 | 141 | 20 | 65 | 78 | 37 | 11 | 5628 | 1575 | ... | 828 | 838 | 354 | 200 | 11 | 3 | 500.0 | 1 | 0 | 1 |
| 4 | -Andres Galarraga | 321 | 87 | 10 | 39 | 42 | 30 | 2 | 396 | 101 | ... | 48 | 46 | 33 | 805 | 40 | 4 | 91.5 | 1 | 0 | 1 |
5 rows × 21 columns
a. Remove observations with missing Salary and log-transform Salary
hitters = hitters[hitters['Salary'].notna()]
hitters.info()
<class 'pandas.core.frame.DataFrame'>
Int64Index: 263 entries, 1 to 321
Data columns (total 21 columns):
Name           263 non-null object
AtBat          263 non-null int64
Hits           263 non-null int64
HmRun          263 non-null int64
Runs           263 non-null int64
RBI            263 non-null int64
Walks          263 non-null int64
Years          263 non-null int64
CAtBat         263 non-null int64
CHits          263 non-null int64
CHmRun         263 non-null int64
CRuns          263 non-null int64
CRBI           263 non-null int64
CWalks         263 non-null int64
PutOuts        263 non-null int64
Assists        263 non-null int64
Errors         263 non-null int64
Salary         263 non-null float64
League_N       263 non-null uint8
Division_W     263 non-null uint8
NewLeague_N    263 non-null uint8
dtypes: float64(1), int64(16), object(1), uint8(3)
memory usage: 39.8+ KB
hitters.loc[:, 'Salary'] = np.log(hitters['Salary'])
b. Train test split
from sklearn.model_selection import train_test_split

X, y = hitters.drop(columns=['Name', 'Salary']), hitters['Salary']
X_train, X_test, y_train, y_test = train_test_split(X, y, train_size=200)
c. Boosting on training set
We used this article to suggest customary values of the boosting parameter (the “learning rate”)
from sklearn.ensemble import GradientBoostingRegressor
from sklearn.model_selection import GridSearchCV

params = {'learning_rate': [0.0001, 0.001, 0.01, 0.1, 0.2, 0.3]}
boost_tree = GradientBoostingRegressor(n_estimators=1000)
boost_tree_search = GridSearchCV(estimator=boost_tree,
                                 param_grid=params,
                                 cv=10,
                                 scoring='neg_mean_squared_error')
%timeit -n1 -r1 boost_tree_search.fit(X_train, y_train)
19.3 s ± 0 ns per loop (mean ± std. dev. of 1 run, 1 loop each)
boost_tree_search.best_params_
{'learning_rate': 0.01}
-boost_tree_search.best_score_
0.0066770413811597165
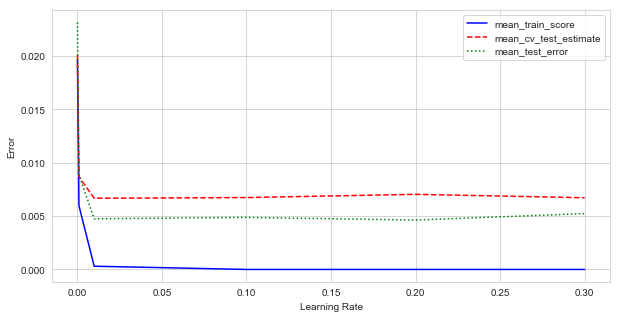
d. Plotting train error, cv test error estimate, and test error
from sklearn.metrics import mean_squared_error

boost_tree_search_df = pd.DataFrame(boost_tree_search.cv_results_)

plt.figure(figsize=(10, 5))
x = boost_tree_search_df['param_learning_rate']
y = -boost_tree_search_df['mean_train_score']
plt.plot(x, y, '-b')

y = -boost_tree_search_df['mean_test_score']
plt.plot(x, y, '--r', label='mean_cv_test_estimate')

y = []
for rate in params['learning_rate']:
    boost_tree = GradientBoostingRegressor(n_estimators=1000, learning_rate=rate).fit(X_train, y_train)
    y += [mean_squared_error(y_test, boost_tree.predict(X_test))]
plt.plot(x, y, ':g', label='mean_test_error')
plt.xlabel('Learning Rate')
plt.ylabel('Error')
plt.legend()
<matplotlib.legend.Legend at 0x1a180ac550>
e. Comparing errors with OLS, Lasso, and Ridge Regression models
from sklearn.linear_model import LinearRegression, Lasso, Ridge
from sklearn.model_selection import cross_val_score

# df for comparison results
comp_df = pd.DataFrame(index=['OLS', 'Ridge', 'Boosted Tree'], columns=['mse_train', 'cv_mse_test', 'mse_test'])

# OLS linear regression errors
linreg = LinearRegression()
linreg.fit(X_train, y_train)
comp_df.at['OLS', 'mse_train'] = mean_squared_error(linreg.predict(X_train), y_train)
comp_df.at['OLS', 'cv_mse_test'] = np.mean(-cross_val_score(linreg, X_train, y_train, cv=10,
                                                            scoring='neg_mean_squared_error'))
comp_df.at['OLS', 'mse_test'] = mean_squared_error(linreg.predict(X_test), y_test)

# Lasso Regression errors
params = {'alpha': [0.001, 0.01, 0.1, 1, 10, 100]}
lasso = Lasso(max_iter=10000)
lasso_search = GridSearchCV(lasso, param_grid=params, cv=10, scoring='neg_mean_squared_error').fit(X_train, y_train)
lasso_best = lasso_search.best_estimator_
comp_df.at['Lasso', 'mse_train'] = mean_squared_error(lasso_best.predict(X_train), y_train)
comp_df.at['Lasso', 'cv_mse_test'] = np.mean(-cross_val_score(lasso_best, X_train, y_train, cv=10,
                                                            scoring='neg_mean_squared_error'))
comp_df.at['Lasso', 'mse_test'] = mean_squared_error(lasso_best.predict(X_test), y_test)

# Ridge Regression errors
ridge = Ridge(max_iter=10000)
ridge_search = GridSearchCV(ridge, param_grid=params, cv=10, scoring='neg_mean_squared_error').fit(X_train, y_train)
ridge_best = ridge_search.best_estimator_
comp_df.at['Ridge', 'mse_train'] = mean_squared_error(ridge_best.predict(X_train), y_train)
comp_df.at['Ridge', 'cv_mse_test'] = np.mean(-cross_val_score(ridge_best, X_train, y_train, cv=10,
                                                            scoring='neg_mean_squared_error'))
comp_df.at['Ridge', 'mse_test'] = mean_squared_error(ridge_best.predict(X_test), y_test)

# Boosted Tree errors
boost_tree_best = boost_tree_search.best_estimator_
comp_df.at['Boosted Tree', 'mse_train'] = mean_squared_error(boost_tree_best.predict(X_train), y_train)
comp_df.at['Boosted Tree', 'cv_mse_test'] = np.mean(-cross_val_score(boost_tree_best, X_train, y_train, cv=10,
                                                            scoring='neg_mean_squared_error'))
comp_df.at['Boosted Tree', 'mse_test'] = mean_squared_error(boost_tree_best.predict(X_test), y_test)
Here’s the model comparison in order of increasing training error
comp_df.sort_values(by='mse_train')
| mse_train | cv_mse_test | mse_test | |
|---|---|---|---|
| Boosted Tree | 0.00037481 | 0.00662225 | 0.00473355 |
| OLS | 0.0113734 | 0.0148324 | 0.0100858 |
| Lasso | 0.0114361 | 0.014843 | 0.00972244 |
| Ridge | 0.0114704 | 0.0146984 | 0.00965864 |
And cv test error estimate
comp_df.sort_values(by='cv_mse_test')
| mse_train | cv_mse_test | mse_test | |
|---|---|---|---|
| Boosted Tree | 0.00037481 | 0.00662225 | 0.00473355 |
| Ridge | 0.0114704 | 0.0146984 | 0.00965864 |
| OLS | 0.0113734 | 0.0148324 | 0.0100858 |
| Lasso | 0.0114361 | 0.014843 | 0.00972244 |
And finally test error
comp_df.sort_values(by='mse_test')
| mse_train | cv_mse_test | mse_test | |
|---|---|---|---|
| Boosted Tree | 0.00037481 | 0.00662225 | 0.00473355 |
| Ridge | 0.0114704 | 0.0146984 | 0.00965864 |
| Lasso | 0.0114361 | 0.014843 | 0.00972244 |
| OLS | 0.0113734 | 0.0148324 | 0.0100858 |
The boosted tree is a clear winner in all 3 cases
f. Which variables are the most important in the boosted tree model?
feat_imp_df = pd.DataFrame({'Feature Importance': boost_tree_best.feature_importances_},
                        index=X.columns)
feat_imp_df.sort_values(by='Feature Importance', ascending=False)
| Feature Importance | |
|---|---|
| CAtBat | 0.441317 |
| CHits | 0.152543 |
| CRuns | 0.069480 |
| Hits | 0.049296 |
| CWalks | 0.048265 |
| CRBI | 0.035715 |
| CHmRun | 0.025762 |
| AtBat | 0.025063 |
| Walks | 0.024959 |
| Years | 0.024882 |
| RBI | 0.024426 |
| Runs | 0.022669 |
| Errors | 0.018002 |
| HmRun | 0.015309 |
| PutOuts | 0.014301 |
| Assists | 0.005260 |
| League_N | 0.001742 |
| NewLeague_N | 0.000780 |
| Division_W | 0.000229 |
Bagged tree
from sklearn.ensemble import BaggingRegressor

# Bagged Tree randomized CV search for rough hyperparameter tuning
params = {'n_estimators': np.arange(1, 100, 10)}
bag_tree = BaggingRegressor()
bag_tree_search = GridSearchCV(estimator=bag_tree, param_grid=params, cv=10,
                               scoring='neg_mean_squared_error')
bag_tree_best = bag_tree_search.fit(X_train, y_train).best_estimator_

%timeit -n1 -r1 bag_tree_search.fit(X_train, y_train)
7.55 s ± 0 ns per loop (mean ± std. dev. of 1 run, 1 loop each)
bag_tree_search.best_params_
{'n_estimators': 21}
bag_tree_best = bag_tree_search.best_estimator_

# Bagged Tree errors
comp_df.at['Bagged Tree', 'mse_train'] = mean_squared_error(bag_tree_best.predict(X_train), y_train)
comp_df.at['Bagged Tree', 'cv_mse_test'] = np.mean(-cross_val_score(bag_tree_best, X_train, y_train, cv=10,
                                                            scoring='neg_mean_squared_error'))
comp_df.at['Bagged Tree', 'mse_test'] = mean_squared_error(bag_tree_best.predict(X_test), y_test)

comp_df.sort_values(by='mse_test')
| mse_train | cv_mse_test | mse_test | |
|---|---|---|---|
| Bagged Tree | 0.00100862 | 0.0064751 | 0.0045024 |
| Boosted Tree | 0.00037481 | 0.00662225 | 0.00473355 |
| Ridge | 0.0114704 | 0.0146984 | 0.00965864 |
| Lasso | 0.0114361 | 0.014843 | 0.00972244 |
| OLS | 0.0113734 | 0.0148324 | 0.0100858 |